ECharts常用案例
柱状图
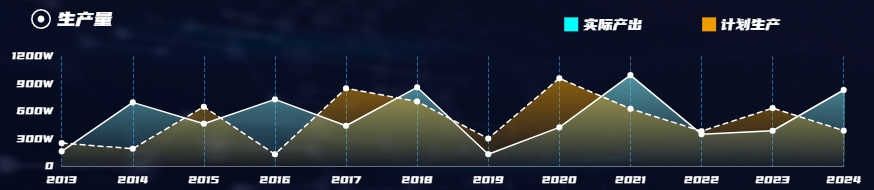
1. 渐变底色、线种类、自定义标题、自定义图例
效果
Option
javascript
{
    // 图例
    legend: {
      show: true,
      selectedMode: false,
      top: 14,
      right: 50,
      itemGap: 30,
      itemWidth: 14,
      itemHeight: 14,
      textStyle: {
        color: "#ffffff",
        fontSize: 16
      },
      data: [
        {
          name: "实际",
          icon: "rect",
          itemStyle: {
            color: "#01ffff",
          },
        },
        {
          name: "计划",
          icon: "rect",
          itemStyle: {
            color: "#ef9c00",
          },
        },
      ],
    },
    // 标题
    title: {
      show: true,
      text: "{a|}{b|钾混盐}",
      top: 6,
      left: 30,
      textStyle: {
        rich: {
          a: {
            backgroundColor: { image: point },
            height: 20,
            width: 20,
          },
          b: {
            color: "#ffffff",
            padding: [0, 0, 0, 6],
            fontSize: 20,
          },
        },
      },
    },
    series: [
      // 第一个图表
      {
        data: dataA, // 数据
        name: "实际", // 名字,用于和图例对应
        type: "line", // 类型,此处为折线图
        symbol: "circle", // 每一处描点的标记图形
        symbolSize: 6, // 标记图形大小
        itemStyle: {
          color: "#ffffff", // 标记图形颜色
        },
        // 区域填充样式,设置后显示成区域面积图
        areaStyle: {
          color: new echarts.graphic.LinearGradient(0, 0, 0, 1, [
            {
              offset: 0,
              color: "#70cdd5FF",
            },
            {
              offset: 1,
              color: "#70cdd511",
            },
          ]),
        },
        // 线条样式
        lineStyle: {
          width: 2,
          color: "#ffffff",
        },
      },
      // 第二个图表
      {
        data: dataB, // 数据
        name: "计划",
        type: "line",
        symbol: "circle",
        symbolSize: 6,
        itemStyle: {
          color: "#ffffff",
        },
        areaStyle: {
          color: new echarts.graphic.LinearGradient(0, 0, 0, 1, [
            {
              offset: 0,
              color: "#ef9c00CC",
            },
            {
              offset: 1,
              color: "#ef9c0011",
            },
          ]),
        },
        lineStyle: {
          width: 2,
          color: "#ffffff",
          type: "dashed", // 设为虚线
        },
      },
    ],
  }
2. 使用外部图片
效果

Option
javascript
{
  series: [
    {
      data: dataA,
      type: "line",
      lineStyle: {
        width: 2,
        color: "#00a3f0",
      },
      symbol: "image://" + point,
      symbolSize: 12,
    },
    {
      data: dataB,
      type: "line",
      lineStyle: {
        width: 2,
        color: "#ffc058",
      },
      symbol: "image://" + point,
      symbolSize: 12,
    },
  ],
}
饼图
折线图
1. 顶部带有方块+统计数值
效果

Option
javascript
{
    series: [
      {
        data: dataA,
        type: "bar",
        barWidth: 12,
        // 用label的背景色模拟出顶部的白色方块
        label: {
          show: true,
          fontSize: 0,
          width: 12,
          height: 2,
          backgroundColor: "#ffffff",
          position: "end",
        },
        // 用markpoint做顶部统计数值
        markPoint: {
          symbolSize: 0,
          label: {
            show: true,
            offset: [0, -12],
            color: "#53fd07",
            fontSize: 12,
            formatter: (params) => {
              return `${params.value}个`;
            },
          },
          data: dataA.map((e, i) => {
            return {
              name: i,
              value: e,
              xAxis: i,
              yAxis: e,
            };
          }),
        },
        // 柱状图配置
        itemStyle: {
          color: new echarts.graphic.LinearGradient(0, 0, 0, 1, [
            {
              offset: 0,
              color: "#5fec8c",
            },
            {
              offset: 1,
              color: "#26502c",
            },
          ]),
        },
      },
      {
        data: dataB,
        type: "bar",
        barWidth: 12,
        label: {
          show: true,
          fontSize: 0,
          width: 12,
          height: 2,
          backgroundColor: "#ffffff",
          position: "end",
        },
        markPoint: {
          symbolSize: 0,
          label: {
            show: true,
            offset: [0, -12],
            color: "#ffffff",
            fontSize: 12,
            formatter: (params) => {
              return `${params.value}个`;
            },
          },
          data: dataB.map((e, i) => {
            return {
              name: i,
              value: e,
              xAxis: i,
              yAxis: e,
            };
          }),
        },
        itemStyle: {
          color: new echarts.graphic.LinearGradient(0, 0, 0, 1, [
            {
              offset: 0,
              color: "#a8cefd",
            },
            {
              offset: 1,
              color: "#599ff4",
            },
          ]),
        },
      },
    ],
  }